DataBasic #4: Interpreting student data.
Once data has been collecting, useful information must be pulled from it via careful analysis and interpretation. The goal of DataBasic 4 is to provide information about how to identify valid trends in data for future use in a data-based decision-making model.
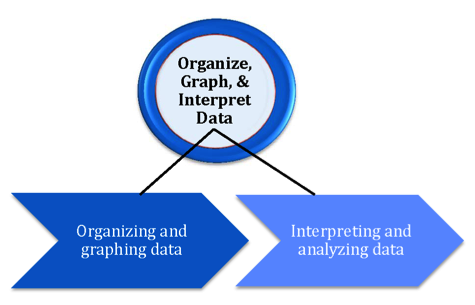
Organizing and Graphing Progress Monitoring Data
This PowerPoint provides direction and practice for organizing and graphing progress monitoring data using Excel and sharing data with others.
Basic Trendlines are used to graphically display trends in data. This video provides an introduction to creating trendlines in Excel.
Phase changes separate baseline data from the data collected during the intervention. The following videos will walk through creating phases in Excel and using phases in progress monitoring graphs