Traditional discipline refers to behavior management strategies that have been used for decades in school systems. These strategies are often not backed by scientific research supporting their effectiveness. That is, some of these strategies have been heavily researched and found to not be effective at changing student behavior, while other strategies simply have not been researched at all. Please view the individual strategy brief pages (linked below) for information on these traditional strategies, how they are typically implemented, and a discussion of their evidence bases. Note: many of these traditional strategies are not recommended due to the evidence that they are not beneficial or are associated with negative outcomes.
Corporal Punishment
Demotion to a Lower Grade
Detention
Expulsion
In-School Suspension
Involuntary Transfer
Lowering Course Grades
Punishment
Saturday School
Suspension


Outside Resources
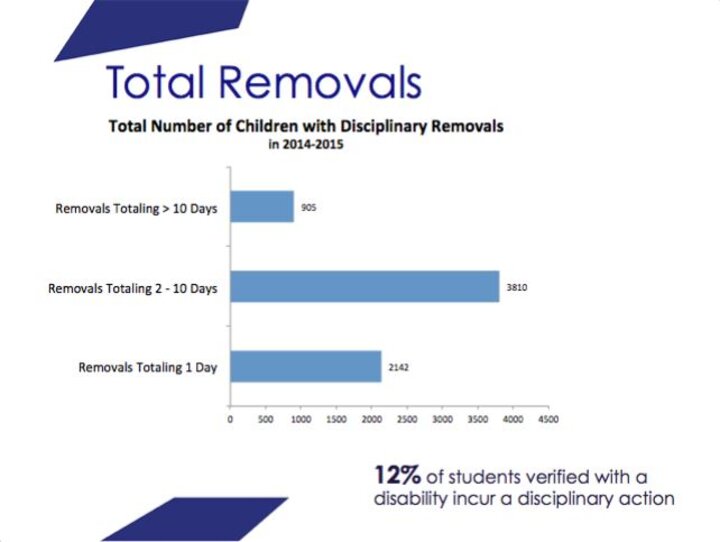
Nebraska Discipline Data for Students with Disabilities
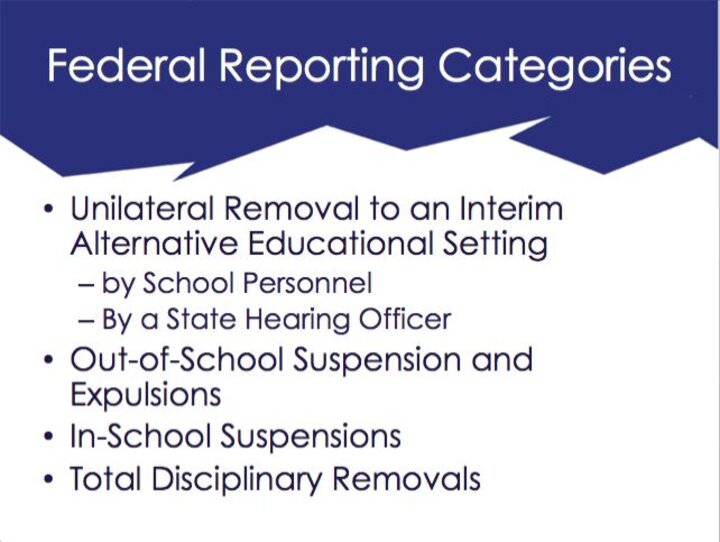
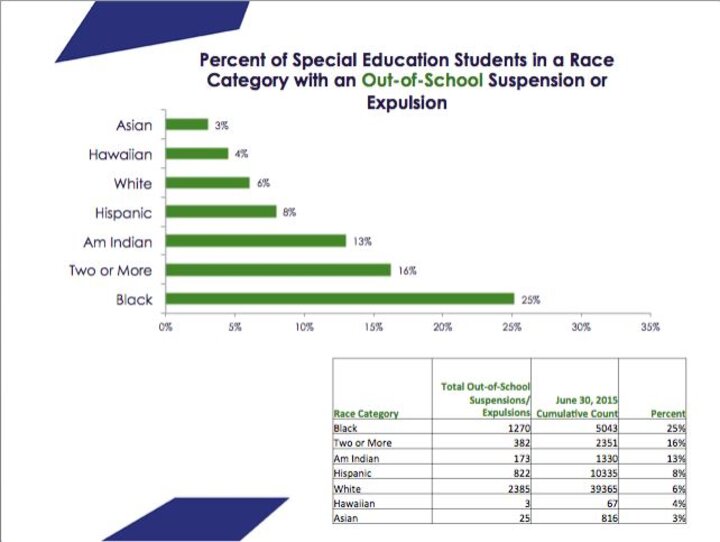
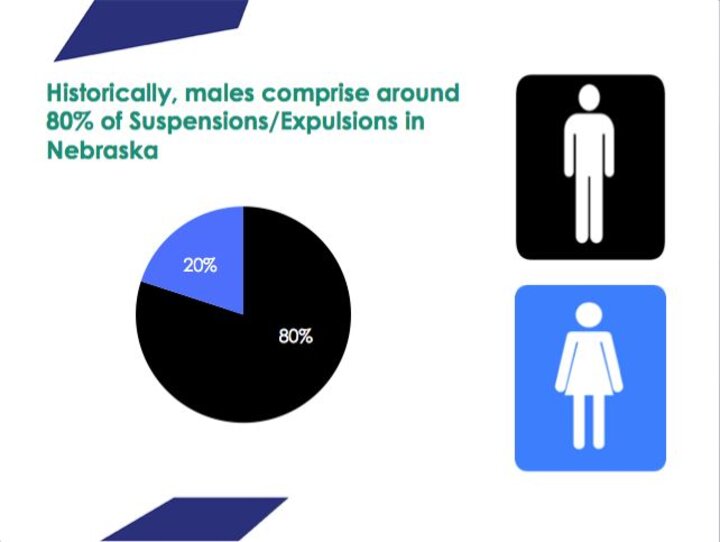
This information and disciplinary data come from the Nebraska Department of Education (NDE) Special Education. These data are from the 2014-2015 academic year and solely represent public school students receiving special education services. The pictures show statistics on traditional exclusionary discipline strategies (i.e., out-of-school suspension, in-school suspension, expulsion, removal). Overall, students with the following characteristics are more likely to receive out-of-school suspension and/or expulsions:
- male,
- identify as black,
- and/or have a verification of emotional disturbance.